T Table - T Distribution (Score, Chart)
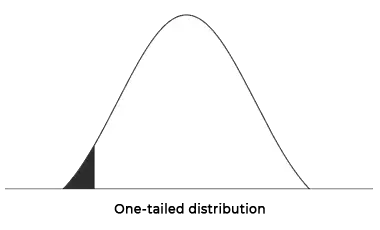
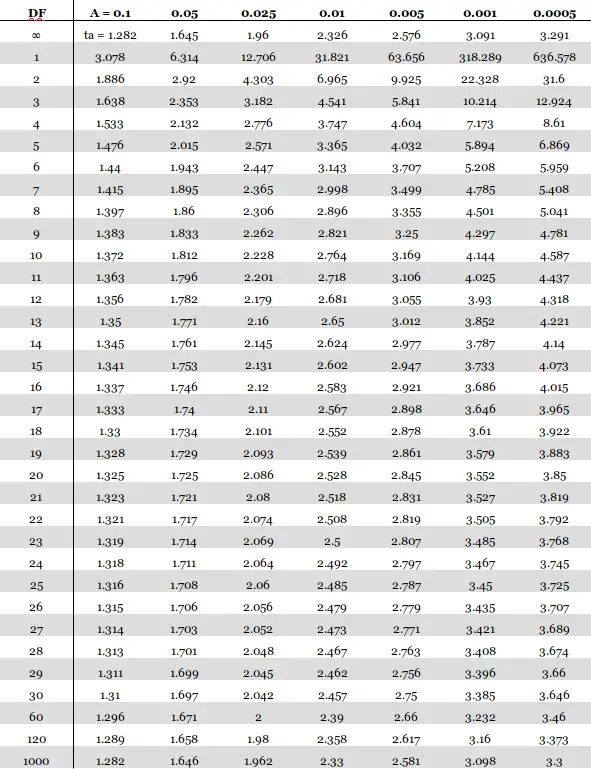
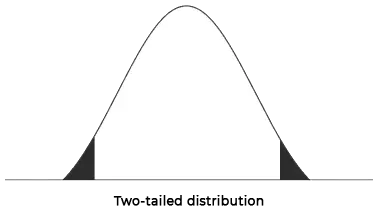
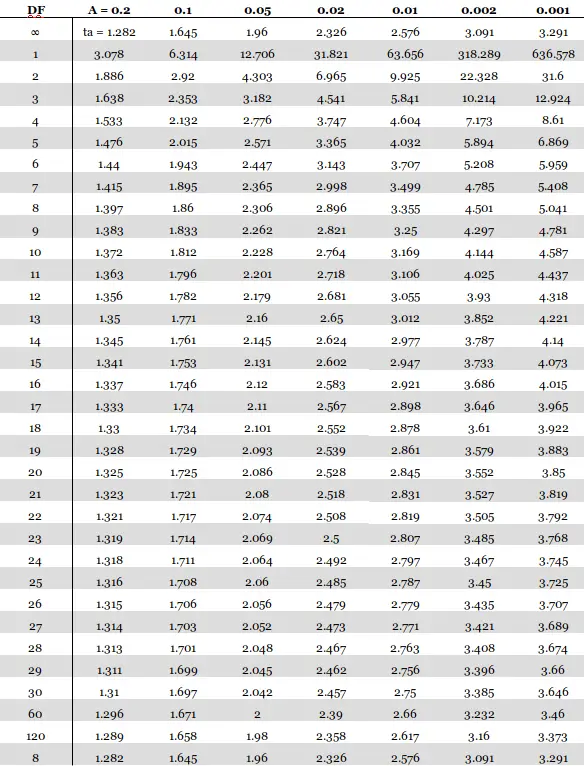
T Table contains the critical values of the T Distribution. The column contains all the T-Distribution probabilities denoted by "Alpha" or "p". The row contains all the degrees of freedom denoted by "df". Also, here you will get one and two tail T score tables or charts online.
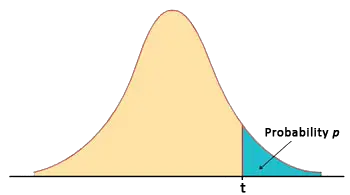
| cum. prob | t.50 | t.75 | t.80 | t.85 | t.90 | t.95 | t.975 | t.99 | t.995 | t.999 | t.9995 |
|---|---|---|---|---|---|---|---|---|---|---|---|
| one-tail | 0.50 | 0.25 | 0.20 | 0.15 | 0.10 | 0.05 | 0.025 | 0.01 | 0.005 | 0.001 | 0.0005 |
| two-tails | 1.00 | 0.50 | 0.40 | 0.30 | 0.20 | 0.10 | 0.05 | 0.02 | 0.01 | 0.002 | 0.001 |
| df/p(α) | |||||||||||
| 1 | 0.000 | 1.000 | 1.376 | 1.963 | 3.078 | 6.314 | 12.71 | 31.82 | 63.66 | 318.31 | 636.62 |
| 2 | 0.000 | 0.816 | 1.061 | 1.386 | 1.886 | 2.920 | 4.303 | 6.965 | 9.925 | 22.327 | 31.599 |
| 3 | 0.000 | 0.765 | 0.978 | 1.250 | 1.638 | 2.353 | 3.182 | 4.541 | 5.841 | 10.215 | 12.924 |
| 4 | 0.000 | 0.741 | 0.941 | 1.190 | 1.533 | 2.132 | 2.776 | 3.747 | 4.604 | 7.173 | 8.610 |
| 5 | 0.000 | 0.727 | 0.920 | 1.156 | 1.476 | 2.015 | 2.571 | 3.365 | 4.032 | 5.893 | 6.869 |
| 6 | 0.000 | 0.718 | 0.906 | 1.134 | 1.440 | 1.943 | 2.447 | 3.143 | 3.707 | 5.208 | 5.959 |
| 7 | 0.000 | 0.711 | 0.896 | 1.119 | 1.415 | 1.895 | 2.365 | 2.998 | 3.499 | 4.785 | 5.408 |
| 8 | 0.000 | 0.706 | 0.889 | 1.108 | 1.397 | 1.860 | 2.306 | 2.896 | 3.355 | 4.501 | 5.041 |
| 9 | 0.000 | 0.703 | 0.883 | 1.100 | 1.383 | 1.833 | 2.262 | 2.821 | 3.250 | 4.297 | 4.781 |
| 10 | 0.000 | 0.700 | 0.879 | 1.093 | 1.372 | 1.812 | 2.228 | 2.764 | 3.169 | 4.144 | 4.587 |
| 11 | 0.000 | 0.697 | 0.876 | 1.088 | 1.363 | 1.796 | 2.201 | 2.718 | 3.106 | 4.025 | 4.437 |
| 12 | 0.000 | 0.695 | 0.873 | 1.083 | 1.356 | 1.782 | 2.179 | 2.681 | 3.055 | 3.930 | 4.318 |
| 13 | 0.000 | 0.694 | 0.870 | 1.079 | 1.350 | 1.771 | 2.160 | 2.650 | 3.012 | 3.852 | 4.221 |
| 14 | 0.000 | 0.692 | 0.868 | 1.076 | 1.345 | 1.761 | 2.145 | 2.624 | 2.977 | 3.787 | 4.140 |
| 15 | 0.000 | 0.691 | 0.866 | 1.074 | 1.341 | 1.753 | 2.131 | 2.602 | 2.947 | 3.733 | 4.073 |
| 16 | 0.000 | 0.690 | 0.865 | 1.071 | 1.337 | 1.746 | 2.120 | 2.583 | 2.921 | 3.686 | 4.015 |
| 17 | 0.000 | 0.689 | 0.863 | 1.069 | 1.333 | 1.740 | 2.110 | 2.567 | 2.898 | 3.646 | 3.965 |
| 18 | 0.000 | 0.688 | 0.862 | 1.067 | 1.330 | 1.734 | 2.101 | 2.552 | 2.878 | 3.610 | 3.922 |
| 19 | 0.000 | 0.688 | 0.861 | 1.066 | 1.328 | 1.729 | 2.093 | 2.539 | 2.861 | 3.579 | 3.883 |
| 20 | 0.000 | 0.687 | 0.860 | 1.064 | 1.325 | 1.725 | 2.086 | 2.528 | 2.845 | 3.552 | 3.850 |
| 21 | 0.000 | 0.686 | 0.859 | 1.063 | 1.323 | 1.721 | 2.080 | 2.518 | 2.831 | 3.527 | 3.819 |
| 22 | 0.000 | 0.686 | 0.858 | 1.061 | 1.321 | 1.717 | 2.074 | 2.508 | 2.819 | 3.505 | 3.792 |
| 23 | 0.000 | 0.685 | 0.858 | 1.060 | 1.319 | 1.714 | 2.069 | 2.500 | 2.807 | 3.485 | 3.768 |
| 24 | 0.000 | 0.685 | 0.857 | 1.059 | 1.318 | 1.711 | 2.064 | 2.492 | 2.797 | 3.467 | 3.745 |
| 25 | 0.000 | 0.684 | 0.856 | 1.058 | 1.316 | 1.708 | 2.060 | 2.485 | 2.787 | 3.450 | 3.725 |
| 26 | 0.000 | 0.684 | 0.856 | 1.058 | 1.315 | 1.706 | 2.056 | 2.479 | 2.779 | 3.435 | 3.707 |
| 27 | 0.000 | 0.684 | 0.855 | 1.057 | 1.314 | 1.703 | 2.052 | 2.473 | 2.771 | 3.421 | 3.690 |
| 28 | 0.000 | 0.683 | 0.855 | 1.056 | 1.313 | 1.701 | 2.048 | 2.467 | 2.763 | 3.408 | 3.674 |
| 29 | 0.000 | 0.683 | 0.854 | 1.055 | 1.311 | 1.699 | 2.045 | 2.462 | 2.756 | 3.396 | 3.659 |
| 30 | 0.000 | 0.683 | 0.854 | 1.055 | 1.310 | 1.697 | 2.042 | 2.457 | 2.750 | 3.385 | 3.646 |
| 40 | 0.000 | 0.681 | 0.851 | 1.050 | 1.303 | 1.684 | 2.021 | 2.423 | 2.704 | 3.307 | 3.551 |
| 60 | 0.000 | 0.679 | 0.848 | 1.045 | 1.296 | 1.671 | 2.000 | 2.390 | 2.660 | 3.232 | 3.460 |
| 80 | 0.000 | 0.678 | 0.846 | 1.043 | 1.292 | 1.664 | 1.990 | 2.374 | 2.639 | 3.195 | 3.416 |
| 100 | 0.000 | 0.677 | 0.845 | 1.042 | 1.290 | 1.660 | 1.984 | 2.364 | 2.626 | 3.174 | 3.390 |
| 1000 | 0.000 | 0.675 | 0.842 | 1.037 | 1.282 | 1.646 | 1.962 | 2.330 | 2.581 | 3.098 | 3.300 |
| Z | 0.000 | 0.674 | 0.842 | 1.036 | 1.282 | 1.645 | 1.960 | 2.326 | 2.576 | 3.090 | 3.291 |
| 0% | 50% | 60% | 70% | 80% | 90% | 95% | 98% | 99% | 99.8% | 99.9% | |
| Confidence Level | |||||||||||


